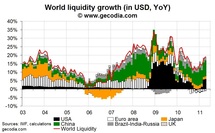
The moderation of the world liquidity growth in the second half of 2010 was short lived. In April 2011 G20 base money* rose by 19.1% per annum. March is revised sharply higher to 17.8% from 15.8%. China remained the most important contributor to the global liquidity (+9.5 pp, 50% of total growth). The US liquidity is also growing rapidly (+5.9 pp, thanks to the quantitative easing of the Fed). The contribution of the other largest emerging countries (Brazil-India-Russia) was stable, as for Japan. On the other side, the liquidity in the euro area is still decreasing (-1.0 pp).
The reasons why the growth of liquidity in China is so ample are: appreciation of the Renminbi against the USD (-4.8% YoY for the USD/CNY), still strong demand for credit and massive inflows of speculative investment (hot money). In The US, it is the QE2 that pushes up the base money but this will end (on a sequential basis) in June. In the euro area, the ECB has begun its exit strategy in the end of last year and excess liquidity lend to banks almost dried up since then.
Economic Impacts
A rapid expansion of the world liquidity, thanks to the Fed and the emerging world, is a strong support to risky assets (mainly equities and commodities). By the end of the summer, the growth is very likely to rise close to 25% YoY. However keep in mind that on a monthly basis, the impulse will fade away by the end of June (QE2 over). Moreover, monetary tightening in the BRIC is also expected to lead to a gradual slowdown in liquidity growth.
In conclusion, on the very short run, world liquidity will remain ample and positive for markets. But, this will fade away after the summer.
* World liquidity = Sum of central bank money. We use the base money in USD (end of month rate). USD global appreciation or depreciation
 World GDP


